Freelance
A Work In Progress
Due to confidentiality agreements images are purposefully left small and numbers and names have been changed. Please contact me for more detailed information or any questions.
Customer Journey
Project Length: 1.5 months
Team Members: Solo
Goal: Document all client touchpoints through their first six months of service across five teams and highlight all opportunities to automate client interaction.
Discover: I spent the first two weeks of the project interviewing members from all five internal teams and collecting any existing collateral. I then interviewed three clients to understand what touchpoints felt successful, discover any gaps, and test some templated responses. One area of particular interest was issue resolution. All three clients were satisfied with an automated confirmation of receipt when they submitted a complaint; however, when it came to the actual issue resolution they wanted a personalized response detailing the remedy to their specific complaint.
Define: I then synthesized each team’s touchpoints and plotted them on separate timelines. After plotting them out I had a senior member from each team review my timelines and touchpoints to ensure they were complete and accurate.
This project could have been overwhelming in scope, documenting every interaction a client undergoes in a six-month period has the potential to be endless. By narrowing the scope to documenting only those interactions that are already prescribed internally I was able to focus on finding opportunities for automation.
Deliver: In the end, I found over 15 touchpoints that could be either templated or fully automated. By automating these touchpoints there was a decreased workload for internal teams and a more uniform and expedited customer experience, helping both the end-user and supporting company growth goals.
Client Packages Rebrand & One sheeter
Project Length: 2 weeks
Team Members: Solo
Goal: Rebrand and define two different client service offerings so that it is easy for sales to clearly and consistently display the value in the more expensive service.
Discover: The sales team did not have a list of all of the various amenities included with each service option which lead to inconsistent client expectations and the inability to create enough value for clients to opt into the more premium package. I interviewed four clients, two from each service offering, along with members of the sales team and the operations team. My goal for these interviews was to identify the most impactful differences between the two service offerings and any pain points that were being solved with our premium offerings.
I also worked on a rebranding of the two packages, my goal was to remove the negative connotation existing around the basic package while still keeping the sense of quality around the premium package.
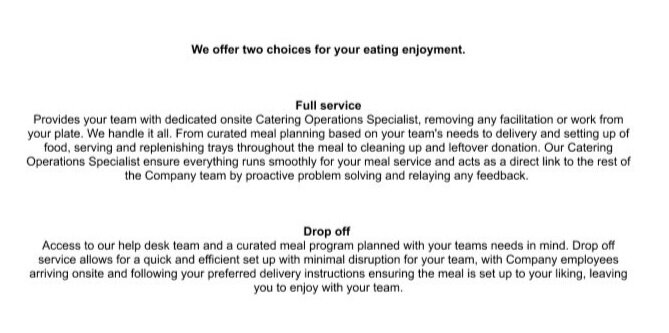
Define: I tested six different package names through a survey with clients and internal teams and landed on “drop off service” and “full service”. These package names removed any connotation about a basic or stripped-down service and were more descriptive of what the client could expect from each package.
Develop: Creating a physical list of all the differences between the two services was a win in itself as this is something that did not previously exist at the company. This helped to clearly define each package and ensured continuity amongst various sales reps.
Deliver: Once in practice, we saw an increase of 30% of existing clients switch to the full-service option and 75% of new clients opt into the full service. This ensured higher margins for the company and created a more streamlined and superior client experience.
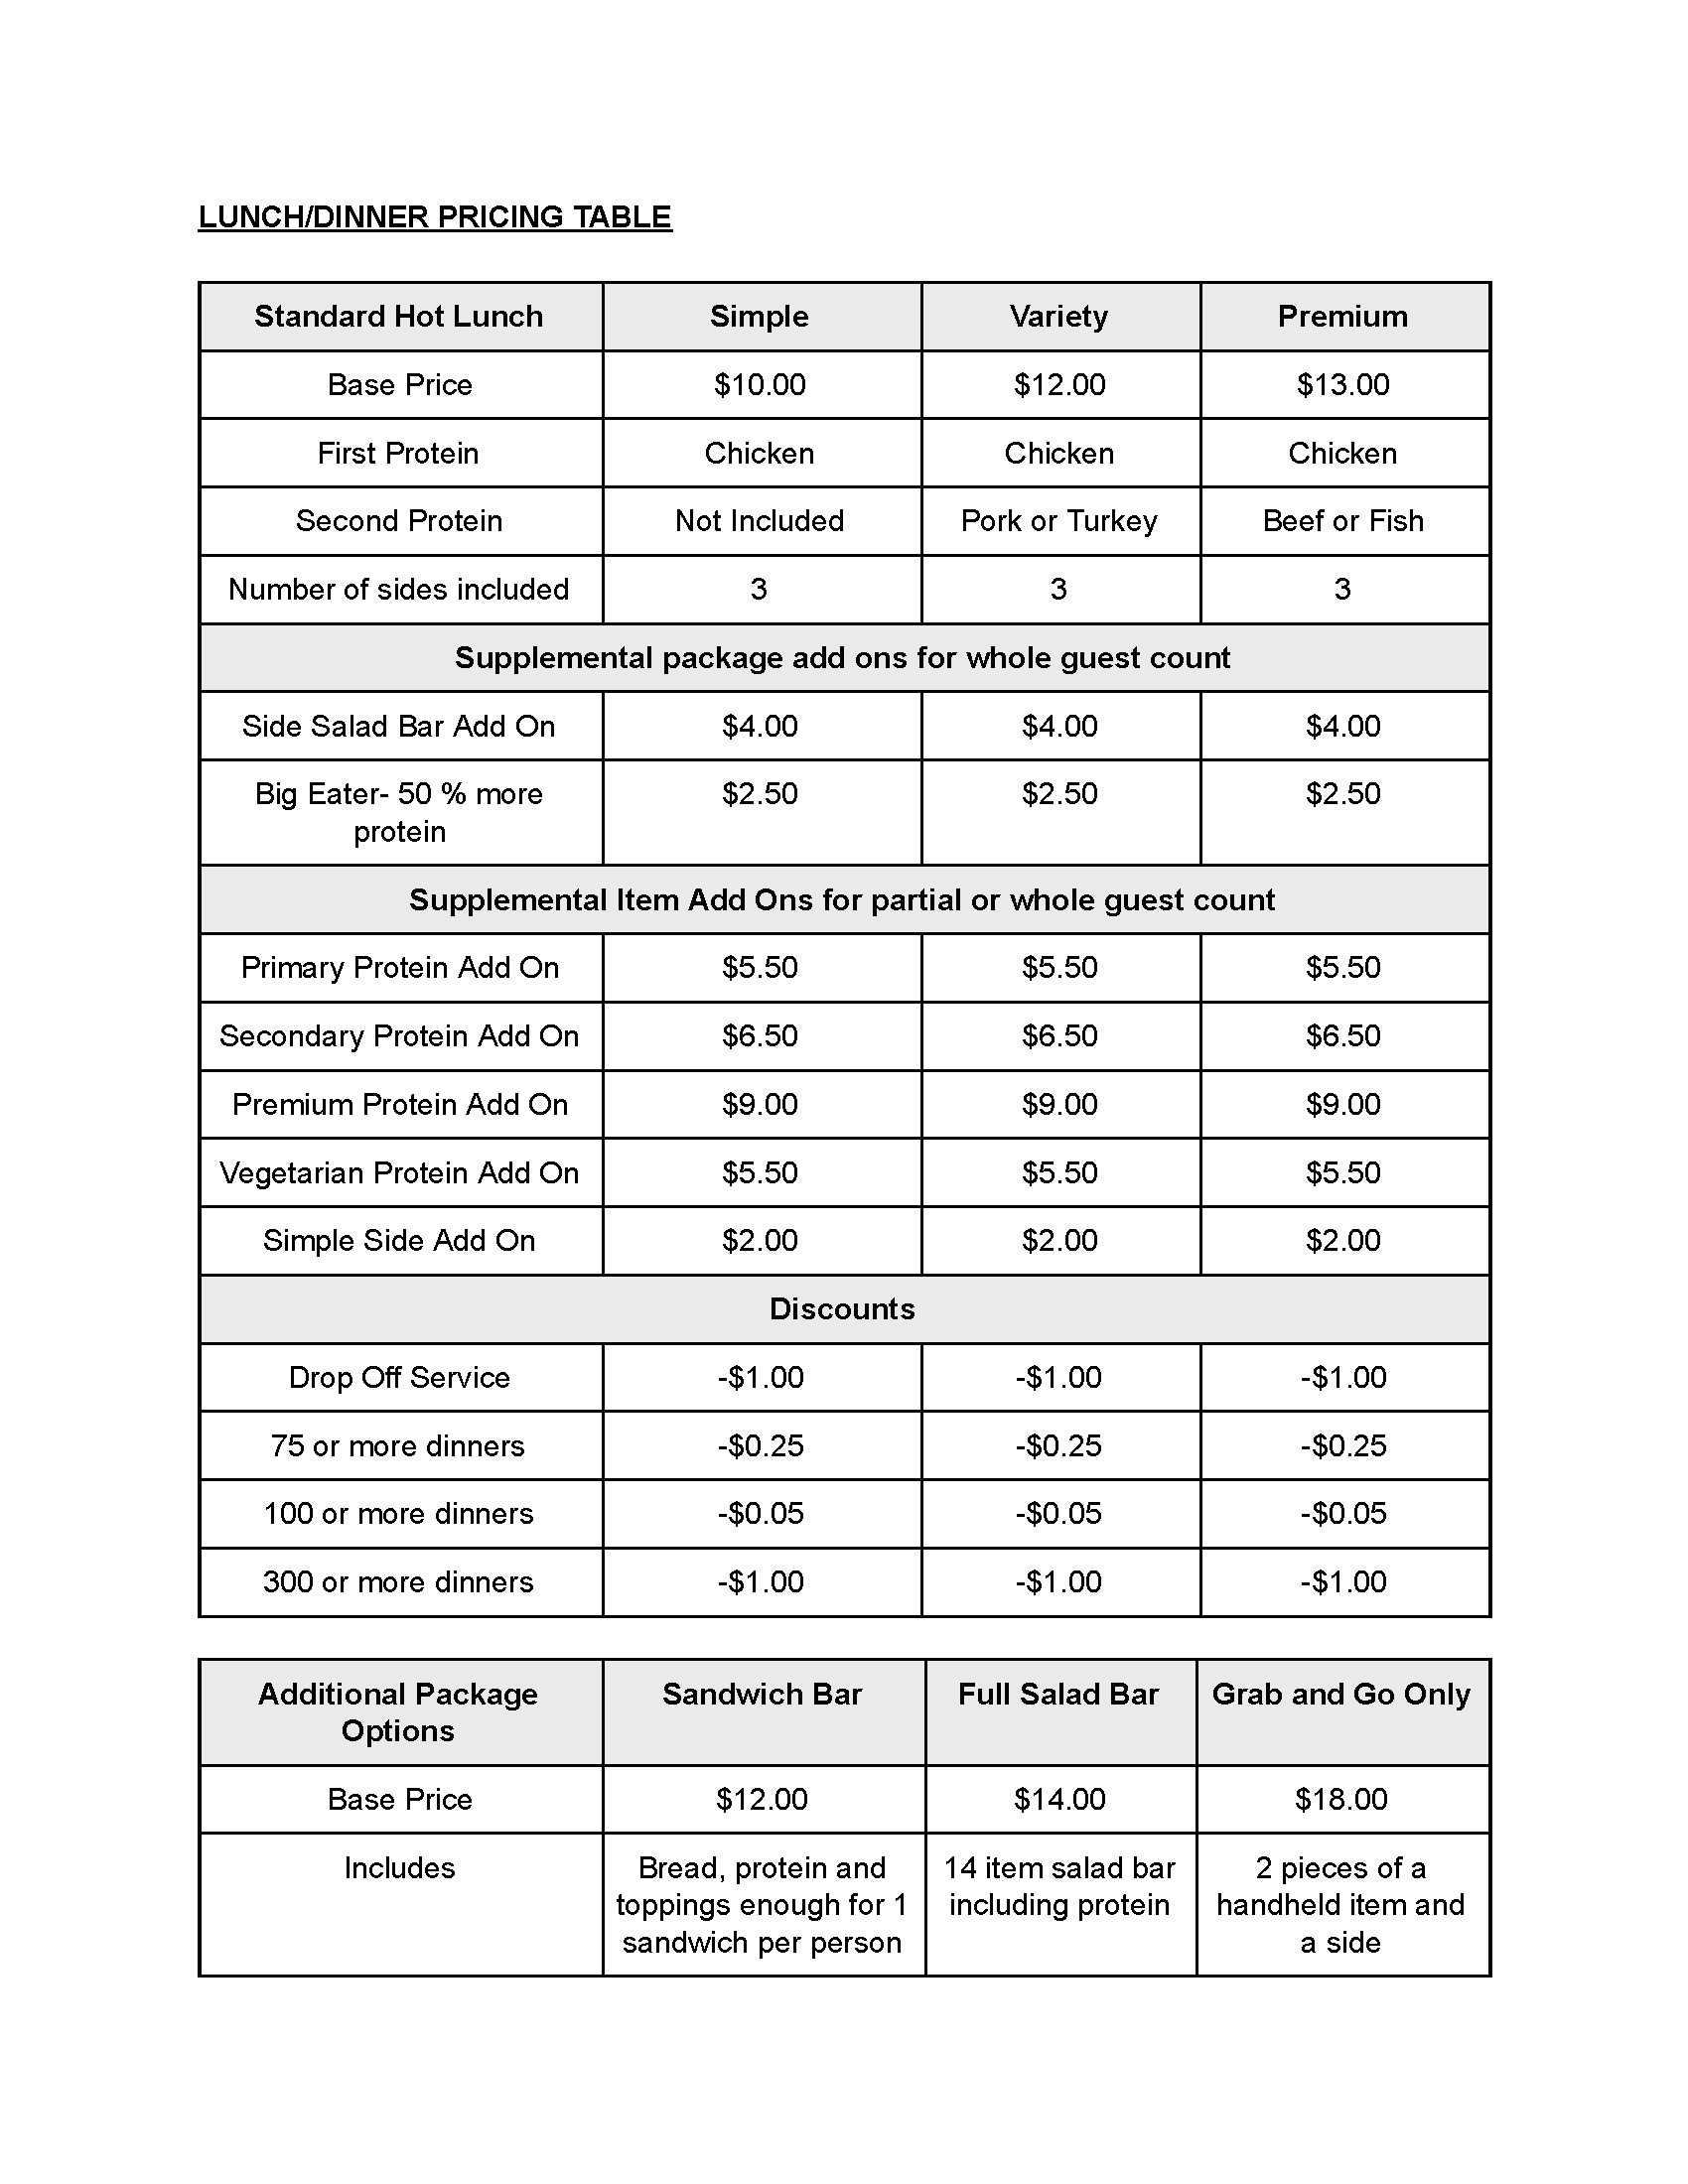
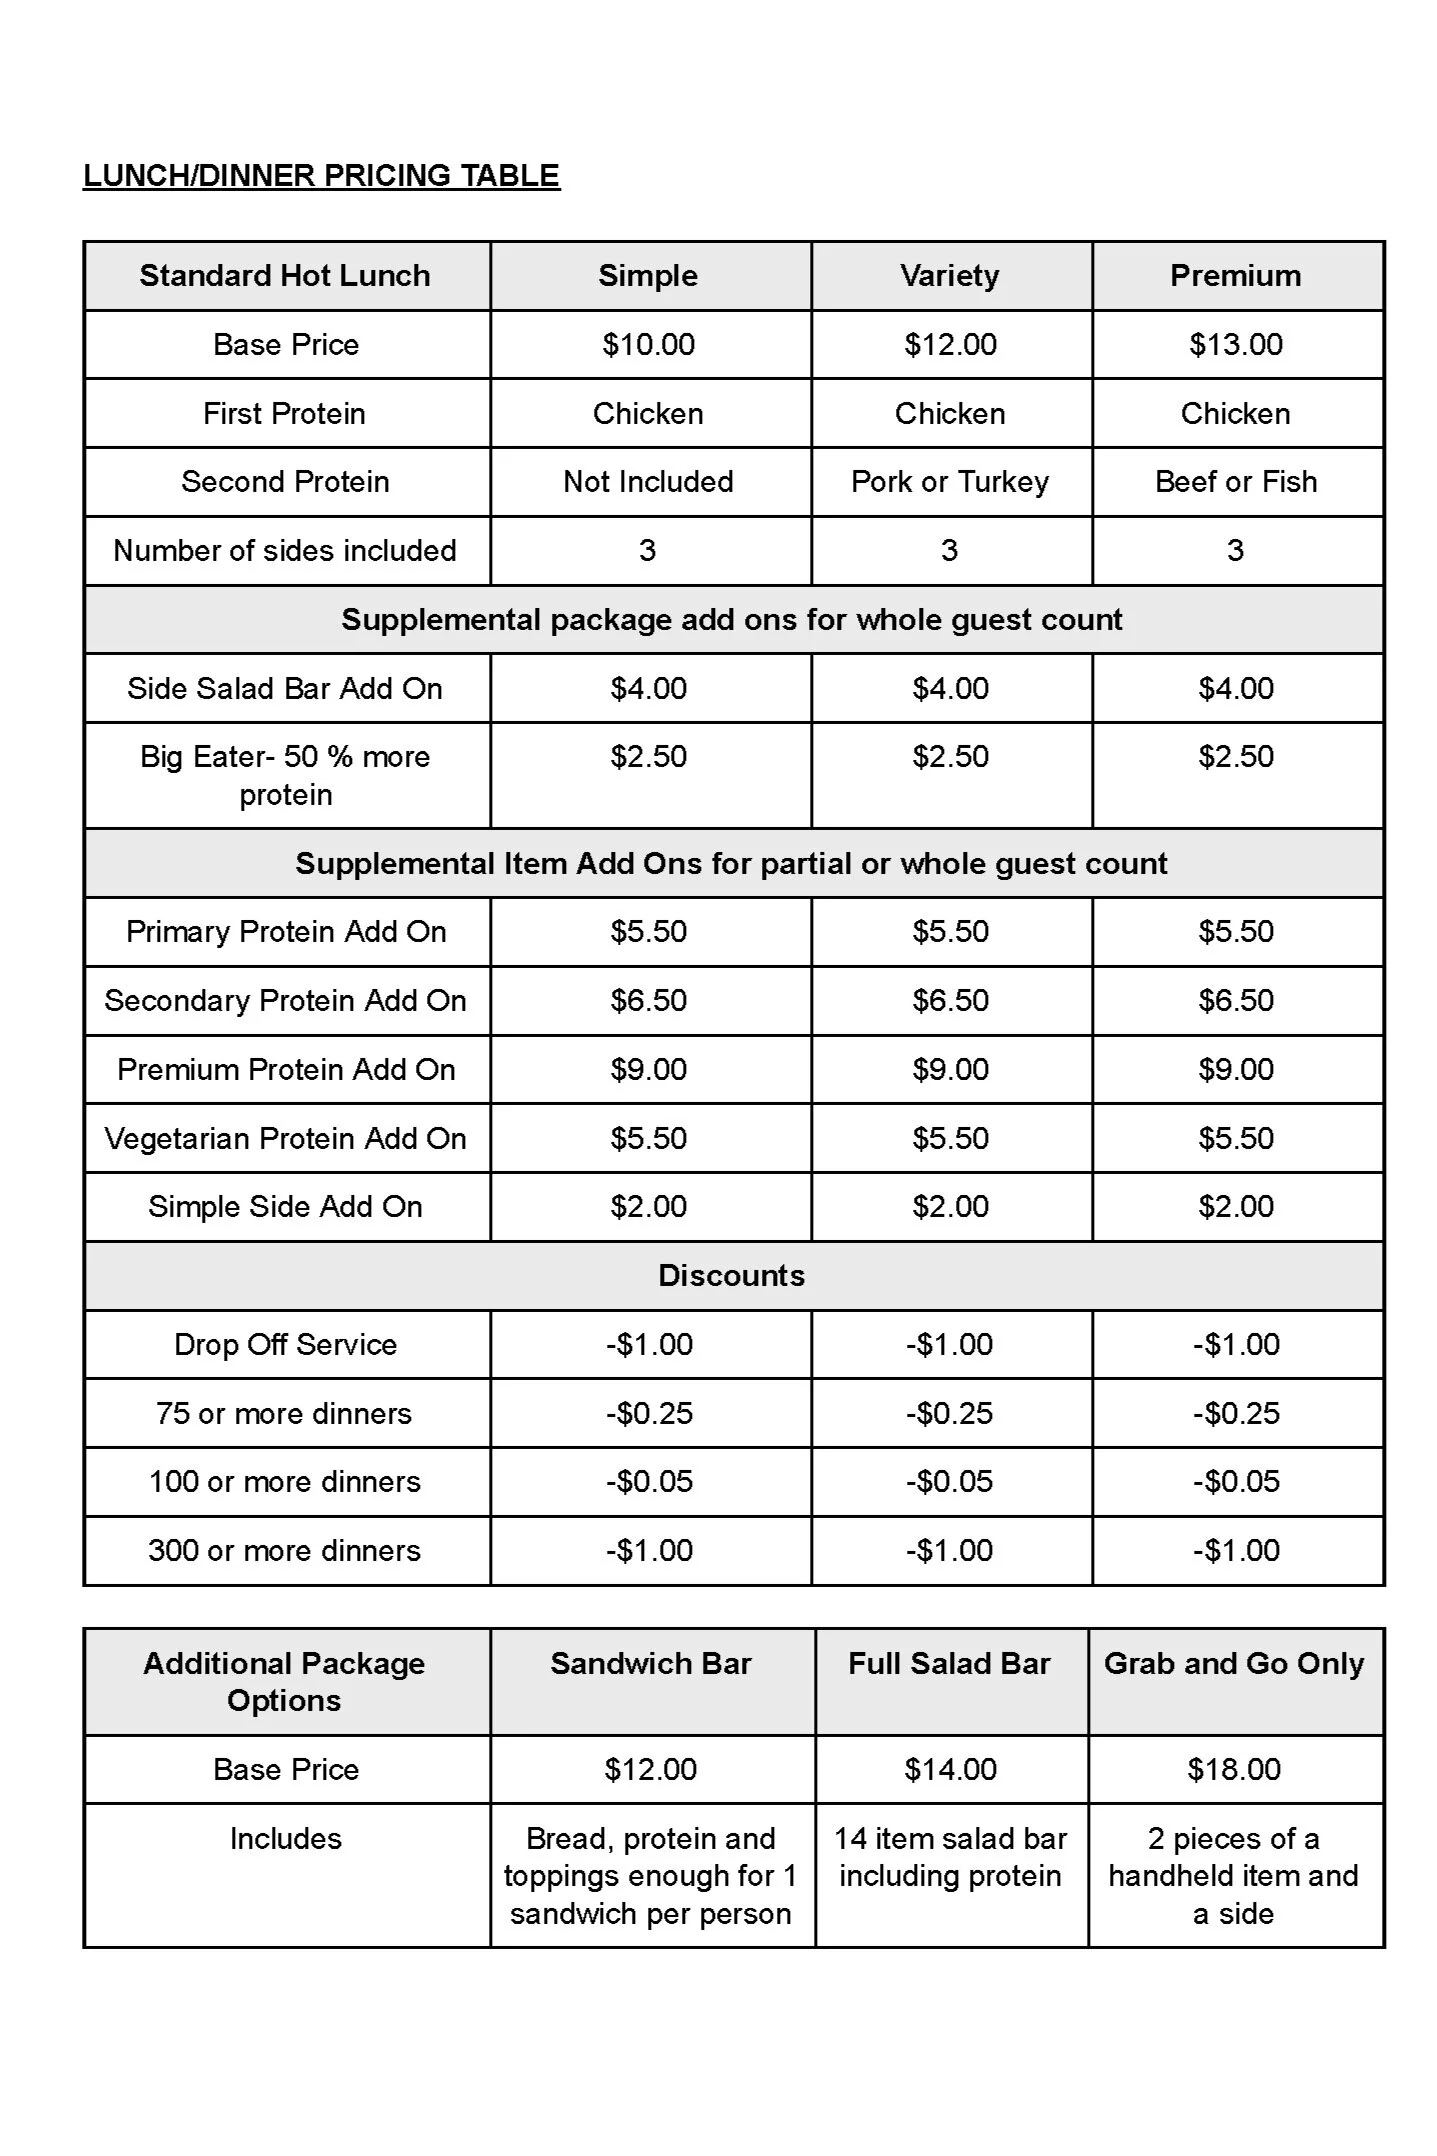
Pricing Tabels
Project Length: 1 month
Team Members: Solo
Goal: Identify, price, and organize client packages and add ons in a clear way to support sales goals and provide transparency for clients.
Discover: This project was very complex and involved buy-in from the C-level executives. Chewse was one of the first food delivery services to define client packages and offer transparent and consistent pricing. Prior to creating pricing tables, sales reps were given a price range based on a client's size and potential order frequency. These ranges led to inconsistency amongst clients, smaller profit margins, and a lack of transparency.
My first task was to research all the various options a client could pay for. I spent time interviewing sales team members, account managers, and our vendor team. I wanted to learn what all clients were receiving outside of the prescribed package offerings. Once I collected this information I went to observe 5 different clients’ meal services. I wanted to see the various package offerings in person and catch anything I might have missed.
Define: After observing meal services and collecting data from our internal teams I created an affinity map. After grouping like items, I worked with the vendor team to price out how much each offering would cost to purchase wholesale and then brought in the finance team to work out what margins would be considered a win for the company without being prohibitive to clients.
One insight that became immediately clear was the need to charge for larger portions of proteins. Restaurants were requested to send a standard 6-8oz of protein per person, however, I found that in many larger offices people were taking seconds and thirds, resulting in protein running out. The existing protocol would be to try and send more protein without charging the client which resulted in poor client experience and a hit to the company's margin. Creating a package that allowed clients to pay for larger portions of protein solved portion issues and supported the company's bottom line.
Develop: With packages, up-charges, discounts and add ons clearly defined and priced, I decided that a table format would be the best way to organize the data. Using a table would be a familiar convention for most clients and allowed me to clearly show the difference in pricing across our three packages. Once I had everything in table format I got feedback from our sales and account management teams, since I had involved everyone early on there was very little to change. With team buy-in, I submitted the final table to the C-suite for approval.
Deliver: Overall feedback from the sales team was glowing, clients were excited at the transparent pricing and willing to pay more money since they could see exactly where that money was going.
After the release of these new packages and add ons there was a 20% increase in gross margin. This was seen mainly from being able to show clients exactly what each offering costs and their willingness to pay extra for specific high-value items like extra protein. Clients were happy to be able to pay for the exact service they needed and the company's margin and overall revenue saw a very tangible boost.